Product Parameter
Working voltage: 8V-12V, current above 1A
Vertical resolution: 12bit
Input impedance: 1M Ω
Simulated bandwidth: 0-200KHz
Coupling method: DC/AC/GND
Trigger type: rising edge/falling edge
Maximum real-time sampling rate: 1MSA/S
Sampling buffer depth: 1024 bytes
Cursor type: horizontal, trigger X, trigger Y
Maximum test voltage: 1X50V, 10X400V
Vertical sensitivity: 10mV/Div-5V/Div (in increments of 1-2-5)
Horizontal time base range: 10us/Div-50s/Div (progressive in a 1-2-5 manner)
Product Features

Turn on/off digital display
Press [SEL] to move the cursor to the base, press and hold the key for about 2 seconds, and then release it to turn on/off digital displays such as voltage and frequency.
Waveform saving and retrieval
Save waveform: Pressing the [SEL] and [+] keys simultaneously will save the currently displayed waveform to the internal memory (it will not disappear when turned off).
Retrieve waveform: Pressing the [SEL] and [-] keys simultaneously will retrieve the waveform stored in the internal memory for display.
Trigger and Trigger Mode
The so-called trigger refers to the event where the signal level crosses a certain level (i.e. trigger level) along a set direction (i.e. trigger edge, with two types of rising and falling). The oscilloscope uses such events as reference points in time to achieve stable display and measurement of waveforms.
There are several common triggering modes:
Auto mode
In automatic mode, regardless of whether there is a trigger, the oscilloscope will continuously update the displayed waveform. If there is a trigger, the waveform will be displayed based on the trigger point as the reference point. Otherwise, the waveform will be displayed randomly. Therefore, when used, it will be found that the waveform display is stable when triggered, and there will be a phenomenon of waveform scrolling when not triggered.
Normal mode
In normal mode, the oscilloscope only updates the waveform display when triggered. If not triggered, the screen waveform will be found to be stationary.
Single mode
Single mode is similar to regular mode in that the waveform display is only updated when triggered. The difference is that in single mode, the waveform display automatically enters a HOLD state and needs to be manually exited before proceeding to the next waveform acquisition and display.
Conventional and single shot modes are commonly used to capture waveforms with fewer chances of occurrence or only appearing once.
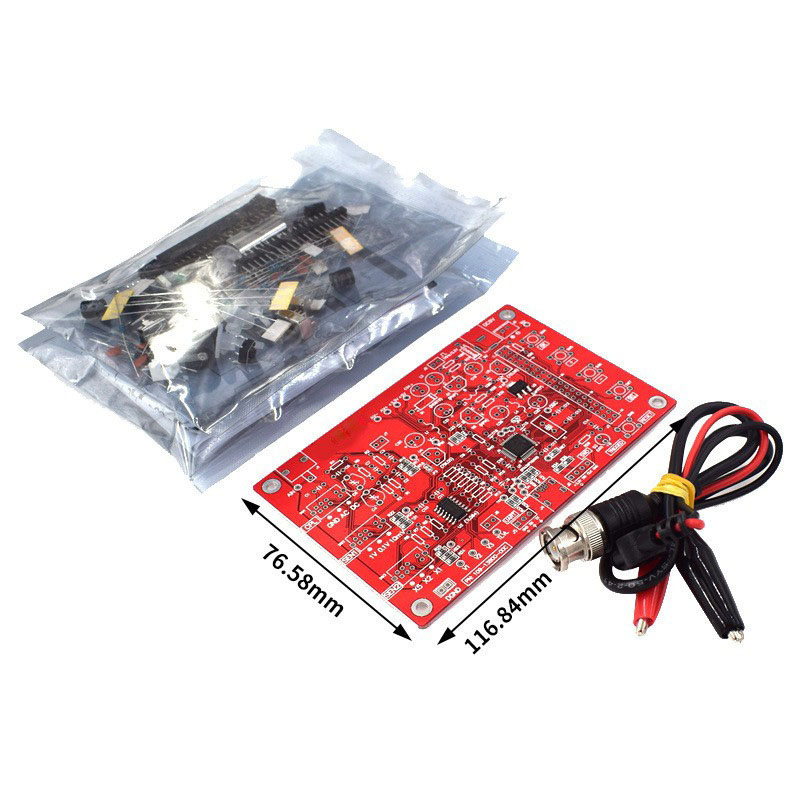
Finally, the DSO138 oscilloscope detects the square wave of the PWM signal output from the generator module.


Connection method
1. Power supply: Connect the power supply to J9 or J10, and the power supply voltage should not exceed the range of 8-12V.
2. Reconnect the DC power supply, and the LCD backlight will light up, displaying the oscilloscope main interface on the screen.
3. Operate various buttons and switches and observe the display of corresponding content on the screen to confirm that their functions are normal.
4. Probe: Connect the probe to J1.
5. Touch the red clip with your finger: Do you see the waveform of the electrical sensing signal from your finger?
Be careful
1. The power supply voltage should not exceed 12V, otherwise U5 will be relatively hot.
The maximum allowable signal voltage when using a fish clip probe is 50V peak (100V peak to peak).

Operation method
Press the [SEL] key: Select the parameter to be adjusted, and highlight the selected parameter.
Press the [+] or [-] keys to adjust the parameter selected by the [SEL] key.
Press the [OK] key to freeze the waveform (i.e. enter HOLD state), press again to unfreeze and restore waveform updates.
Turn the [CPL] switch: Set the coupling mode to DC, AC, Or GND, when placed in the GND position, the oscilloscope input is disconnected from the outside and connected to ground (i.e. 0V input)
Flip the [SEN1] or [SEN2] switch to adjust sensitivity. The product of the set values for [SEN1I] and [SEN2 | is the actual sensitivity and is displayed in the bottom left corner of the screen.
Press the [Reset] key to reset and restart the system.
Press and hold SW4, then press the [Reset] key to enter testing mode.
OV baseline alignment
Sometimes there may be misalignment between the 0V baseline (i.e. the trajectory when the input voltage is 0V) and the vertical position indicator on the left side of the screen, which can be eliminated by performing the "0V baseline alignment" function.
The specific method is to first place [CPL] in the GND position (even if the input is 0V), then press [SEL] to select the vertical position indicator (highlight it), then press and hold the [OK] key for about 2 seconds, and release it. You will see that the 0V baseline is aligned with the vertical position indicator. When the vertical sensitivity is selected to be relatively high, there may still be some misalignment after aligning the 0V baseline. This is due to the high sensitivity and is a normal phenomenon that does not affect the use of the oscilloscope.
Probe compensation calibration
Due to the presence of capacitance between the input terminal of the oscilloscope and ground, the probe of the oscilloscope needs to be compensated and calibrated in order to obtain a more accurate observation effect, especially for high-frequency signals. Probe compensation calibration can be carried out with the help of the built-in signal. The specific steps are as follows:

1. Connect the red clip of the probe to the test signal output terminal, and hang the black clip in the air
2. Place [SEN1] at 0.1V, [SEN2] at X5 position (vertical sensitivity of 0.5V/grid), and [CPL] at AC or DC position respectively.
3. Set the time tone to 0.2ms, and you should see a waveform similar to the photo next to it. If the waveform is unstable, you can adjust the trigger level (pink indicator on the right side of the screen) to make the waveform stable.
4. Use a small screwdriver to adjust C4 (fine tune capacitor) to make the waveform appear sharp and right angled (as shown in Figure C below). At this point, the compensation adjustment in the 0.1V range is complete.
5. Adjust the 1V gear while keeping other settings unchanged. Place [SEN1] in the 1V position and [SEN2] in the X1 position (at this point, the sensitivity is 1V/grid, and the waveform height is slightly different from the figure below). Adjust C6 to display the waveform as a sharp right angle. At this point, the probe compensation calibration is complete.
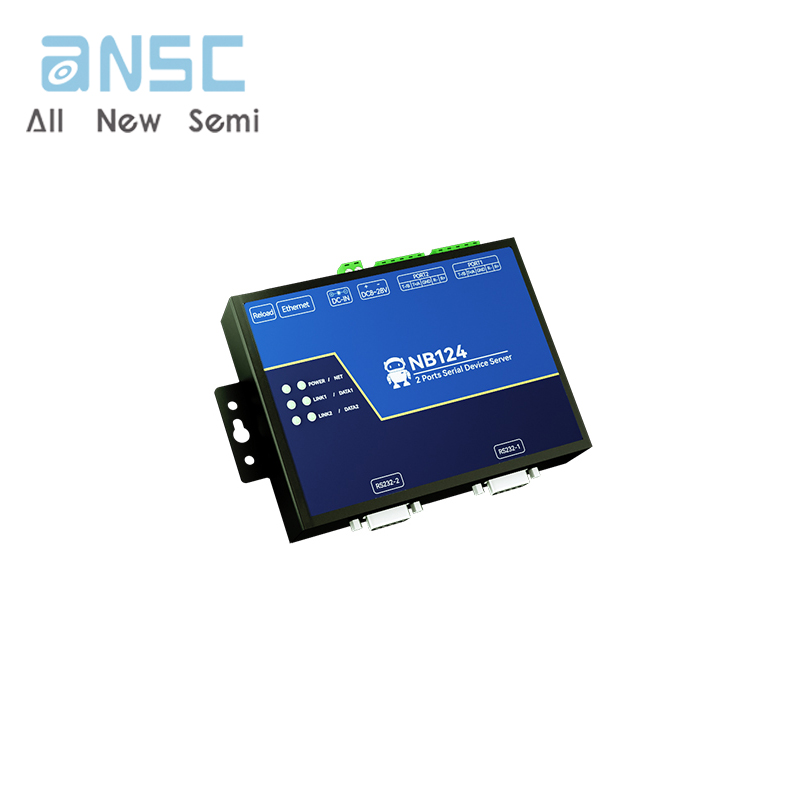
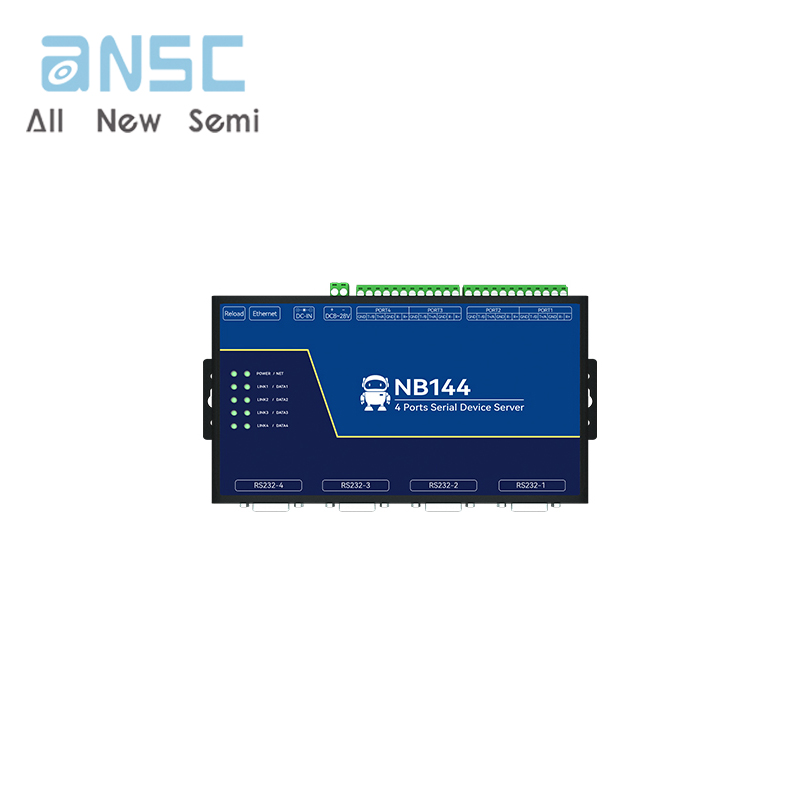
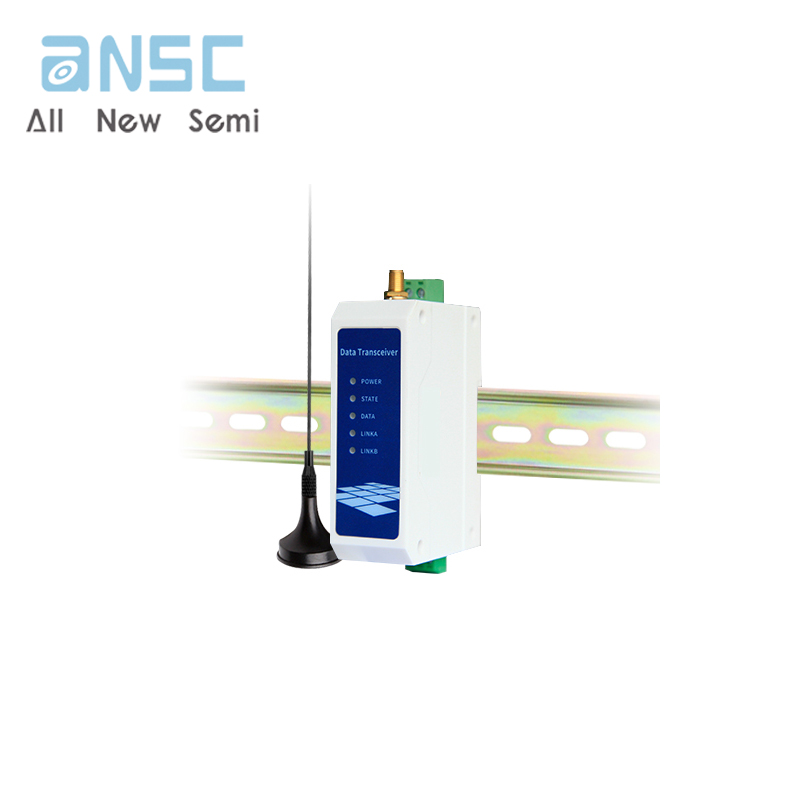
Product Show


Payment&Transportation

Official Certificate&Certificate

Multiple product supply

Company office environment

Warehouse Real Shot

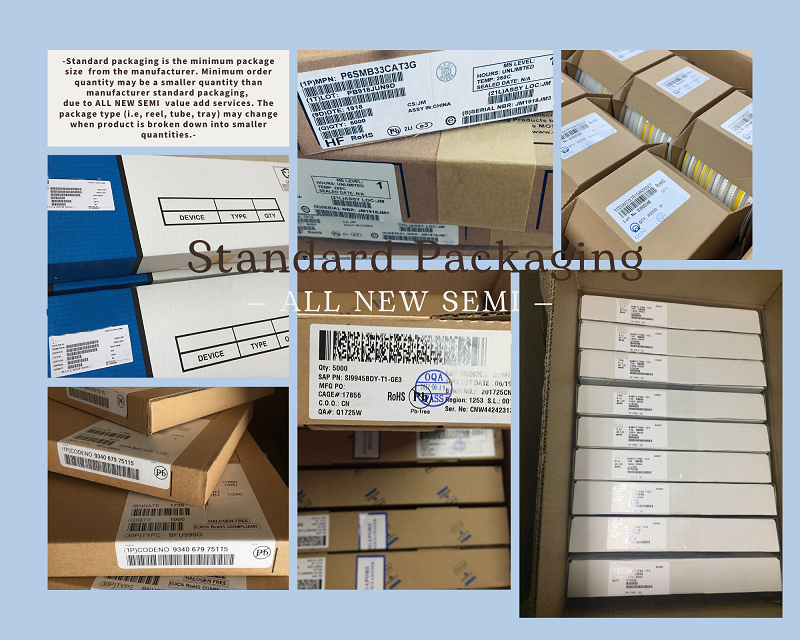
Standard packaging
We also provide :
| Part No | Manufacturer | Date Code | Quantity | Description |
| LM22676ADJ | NS | 19+ | 250 | SOP8 |
| TPS562201DDCR | TI | 22+ | 795500 | SOT23-6 |
| NJG1806K75 | JRC | 22+ | 500000 | DFN6 |
| TLV74318PDQNR | TI | 22+ | 402000 | X2SON-4 |
| NJG1801K75 | JRC | 22+ | 300000 | SMD |
| NJG1804K64 | JRC | 22+ | 300000 | DFN8 |
| LM27761DSGR | TI | 22+ | 151000 | WSON8 |
| TLV62565DBVR | TI | 22+ | 138000 | SOT23-5 |
| TPS613222ADBVR | TI | 22+ | 108000 | SOT23-5 |
| LNK625DG-TL | POWER | 22+ | 100000 | SOP-8 |
| OPA4322AIPWR | TI | 22+ | 100000 | TSSOP14 |
| TLV75528PDRVR | TI | 22+ | 99000 | WSON-6 |
| TPS7A2025PDQNR | TI | 22+ | 78500 | X2SON-4 |
| TLV62568DBVR | TI | 22+ | 72000 | SOT23-5 |
| STM32L051K8U6TR | ST | 22+ | 60000 | QFN32 |
| SKY66421-11 | SKYWORKS | 22+ | 56500 | QFN16 |
| TPS7A1111PDRVR | TI | 22+ | 54000 | WSON6 |
| TLV62569PDDCR | TI | 22+ | 52000 | SOT23-6 |
| TLV62569DBVR | TI | 22+ | 48000 | SOT23-5 |
| TPS23753APWR | TI | 22+ | 40000 | TSSOP14 |
| NB691GG-Z | MPS | 22+ | 30000 | QFN |
| SN74AHC1G02DBVR | TI | 22+ | 27939 | SOT-23 |
| TPS63000DRCR | TI | 22+ | 23238 | VSON10 |
| TLV75533PDRVR | TI | 22+ | 21500 | WSON6 |
| NB687BGQ-Z | MPS | 22+ | 20000 | QFN |
| A3916GESTR-T-1 | ALLEGRO | 22+ | 17150 | QFN-20 |
| TPS62135RGXR | TI | 22+ | 15000 | VQFN11 |
| TLE2022AMDR | TI | 0803+ | 12500 | SOP8 |
| TPS23756PWPR | TI | 22+ | 12000 | HTSSOP-20 |